The farther backward you can look, the farther forward you can see.
– Winston Churchill
If you had only looked at the equity market on the first trading day of this year and not again until the end of June, you would be forgiven for concluding that not much— if any-thing—had happened. In fact, a great deal happened, of course. Let’s begin with the understanding that markets are amoral, apolitical, dispassionate, and unemotional. Historically, they have been indifferent to pandemics, elections, civil unrest, and just about anything else that would cause most humans some kind of visceral reaction. In short, a hu-man exhibiting these characteristics would likely be considered a sociopath or, at the least, would “have some serious things to work on.” Being empathetic, compassionate, and caring are great traits to possess. However, our psychology does not lend itself well to the nuances of how the stock market typically behaves.
After the first 50 days of 2025, the S&P 500 was at an all-time high. Commentators generally credited this strength to excitement concerning the new president. Sixteen short trading days later, the S&P 500 closed down 10% from the peak. Commentators generally blamed this decline on fears concerning the new president. And of course, after “Liberation Day,” April was headed toward its worst month since 1932… until it wasn’t. Oftentimes, the sharpest rebounds occur right after the deepest selloffs. Missing those rebounds can meaningfully detract from one’s long-term wealth. Of the 50 best performing days for the S&P 500 spanning from 1995-2024, nearly 80% of them occurred during bear markets or within the first two months of the beginning of a bull market—meaning one’s timing would have had to be impeccable to not only know when to get out of the market, but exactly when to get back in. Those who have fared best this year are likely the ones who didn’t panic and maintained their long-term asset allocation. As famed Berkshire legend Charlie Munger has said, “There are huge mathematical advantages to doing nothing.”
A famous Wall Street adage states that markets take an elevator up but an escalator down (Anecdotally, at least, this seems to ring true much of the time.) This is a curious notion, as it implies that people are more apt to think that “the world is ending” more frequently than they think “this too shall pass.” History has clearly supported the latter. To wit, from 1961 through 2024, the S&P 500 index has been in a bull market over 80% of the time. There have been skeptics, pessimists, and perma-bears voicing their caution every step of the way! Some may remember the infamous cover page from BusinessWeek in August 1979 with the headline, “The Death of Equities.” For reference, the S&P 500 was around 110 at the time, and as of the close of the second quarter of 2025, it stood at just over 6,200. This brings to mind Mark Twain’s famous quote, “The reports of my death are greatly exaggerated.” There is no guarantee how stocks will behave going forward. But if the past informs the future (and that is really the best assumption we can make), then one’s investment strategy and allocation should not be changed solely based on the next negative event.
Perhaps the four most expensive words in investing are “this time it’s different.” In fairness, yes, it’s always different… depressions, recessions, hedge fund and real estate collapses, a once-in-a-100-year pandemic. The response of the stock market, however, has been fairly predictable over time. The most recent crises du jour have been the conflicts in the Middle East and the tariff announcements (and the many iterations those have taken since initially communicated on April 2). Tariffs will very likely change the calculus for businesses in some way, shape or form. In order to account for the possible impacts, our research team has rank ordered every company we follow by how vulnerable they may be. So, while we don’t normally spend a lot of time trying to forecast macroeconomic events, we believe our company valuations need to take into account the high likelihood that some form of tariffs will be enacted and that these tariffs might stick around for an extended period.
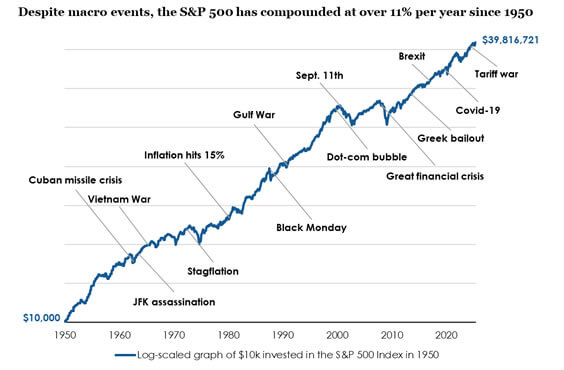
The chart below illustrates just some of the “this time it’s different” events that, no doubt and quite understandably, caused many people distress. As disciplined investors, we look beyond the concerns of today. We focus instead on how, or if, the valuations of the companies in which we are invested have changed when looking out over a full cycle, somewhere in the neighborhood of five to seven years. The periods represented below felt horrible for all of us, but the long-term trend for stocks is clear.

Source: Morningstar Direct, 1/1/1950-6/30/2025. S&P 500 total return data is quarterly until April 1970 and monthly thereafter. Past performance is no guarantee of future results.
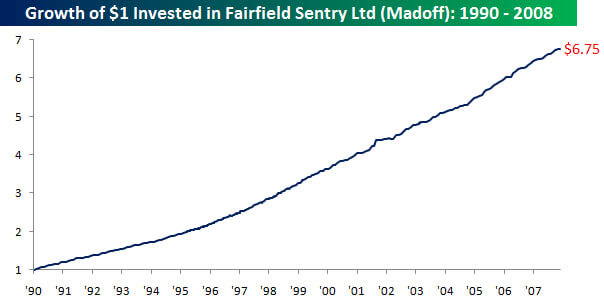
In comparison, this chart shows an unbelievable (truly) string of performance for Fairfield Sentry Ltd. The investment community was blown away by the seemingly risk-free returns in an asset class that for everyone else had proven to be far from risk-free. Of course, the manager, Bernie Madoff, ultimately received his comeuppance, leaving in his wake countless unassuming—and now financially destroyed—clients. Achieving a performance chart that looks like this, with nary a blip in its ascent, is just not realistic.

Source: Bespoke Investment Group1
For illustrative purposes only and not indicative of any actual in-vestment.
The reason stocks perform so well over long periods is that the entry fee for participating is having to endure volatility that scares many people out (this provides opportunity for those who stay in). One definition of a bear market is a period when stocks are returned to their rightful owners. It’s easy to be invested in stocks when the market is going up, but long-term wealth is arguably made during market down-turns, and having the intestinal fortitude to stick with a long-term plan, regardless of how unsettling that may feel.
The reason stocks have historically performed so well over long periods is that the entry fee for participating is having to endure volatility that scares many people out (this provides opportunity for those who stay in). One definition of a bear market is a period when stocks are returned to their rightful owners. It’s easy to be invested in stocks when the market is going up, but long-term wealth is arguably made during market downturns, and having the intestinal fortitude to stick with a long-term plan, regardless of how unsettling that may feel.
There is often a considerable disconnect between a company’s fundamentals and its corresponding stock price. They frequently move in meaningfully different directions, some-times for lengthy periods. One of our most valued services at Harris Associates is to provide guidance to our clients based on history and probability, not emotion. Given the uncertainty of short-term market movements, we always recommend that clients keep between 6-24 months of cash (or other-wise liquid, stable assets such as money market funds) so that they can weather a prolonged market downturn. But ultimately, we believe economic forces are stronger and longer lasting than political ones.
As of this writing, conditions in the U.S. look surprisingly placid. Credit markets are accommodating, inflation is close to the Fed’s 2% target and a weaker dollar suggest things are not as dire as they perhaps feel. Over the next six months, the general expectation is for the Federal Reserve to enact two 25 basis point rate cuts, which should also benefit equities. With that said, as we look forward, tariffs, geo-political uncertainty, and unexpected policy are all potential risks (they always are). And while many stock indexes are once again looking pricey, we still see pockets of the market that look attractive. We will spend our time and resources in pursuit of uncovering the winners of tomorrow by applying our consistent approach of looking for underpriced companies, whose value is growing and that are run by sensible, shareholder-friendly management teams.
As always, we thank you for entrusting us with your investment assets and your continued support. Lastly, the best compliment we can receive is a referral from a satisfied client. We appreciate your referrals and handle them with the utmost care.
Past performance is no guarantee of future results. Current performance may be lower or higher than the performance data quoted. The investment return and principal value vary so that an investor’s shares when redeemed may be worth more or less than the original cost.
The specific securities identified and described in this report do not represent all the securities purchased, sold, or recommended to advisory clients. There is no assurance that any securities discussed herein will remain in an account’s portfolio at the time one receives this report or that securities sold have not been repurchased. It should not be assumed that any of the securities, transactions, or holdings discussed herein were or will prove to be profitable.
This material is not intended to be a recommendation or investment advice, does not constitute a solicitation to buy, sell or hold a security or an investment strategy, and is not provided in a fiduciary capacity. The information provided does not take into account the specific objectives or circumstances of any particular investor or suggest any specific course of action. Investment decisions should be made based on an investor’s objectives and circumstances and in consultation with his or her advisors.
The information, data, analyses, and opinions presented herein (including current investment themes, the portfolio managers’ research and investment process, and portfolio characteristics) are for informational purposes only and represent the investments and views of the portfolio managers and Harris Associates L.P. as of the date written and are subject to change without notice. This content is not a recommendation of or an offer to buy or sell a security and is not warranted to be correct, complete or accurate. Certain comments herein are based on current expectations and are considered “forward-looking statements”. These forward looking statements reflect assumptions and analyses made by the portfolio managers and Harris Associates L.P. based on their experience and perception of historical trends, current conditions, expected future developments, and other factors they believe are relevant. Actual future results are subject to a number of investment and other risks and may prove to be different from expectations. Readers are cautioned not to place undue reliance on the forward-looking statements.
The S&P 500 Index is a float-adjusted, capitalization-weighted index of 500 U.S. large-capitalization stocks representing all major industries. It is a widely recognized index of broad, U.S. equity market performance. Returns reflect the reinvestment of dividends. This index is unman-aged and investors cannot invest directly in this index.
All information provided is as of 06/30/2025 unless otherwise specified.


