
For quite some time, our client conversations, as well as our quarterly letters, have thoroughly discussed the composition and valuation of the S&P 500. In particular, we have analyzed the index’s increasing concentration in a select few names and sectors. While this remains true, this quarter, we hope to expand upon this discussion with a logical subsequent question: How does one begin to mitigate this exposure while not sacrificing expected future return? Ultimately, to answer this question requires a deeper understanding of diversification.
Reflecting on many of our recent conversations, the current desire for diversification does not stem solely from too much concentration. Concentration, in itself, is not inherently detrimental to returns. In fact, we at Harris Associates run concentrated portfolios composed of our best ideas. Rather, it is the combination of concentration and lofty valuations that endangers future returns.
The post-GFC (Great Financial Crisis) period has seen a general upward trend in valuations (as measured by the price-to-earnings ratio), culminating in the S&P 500 currently trading at nearly two standard deviations above its 30-year trailing average:
Figure 1:
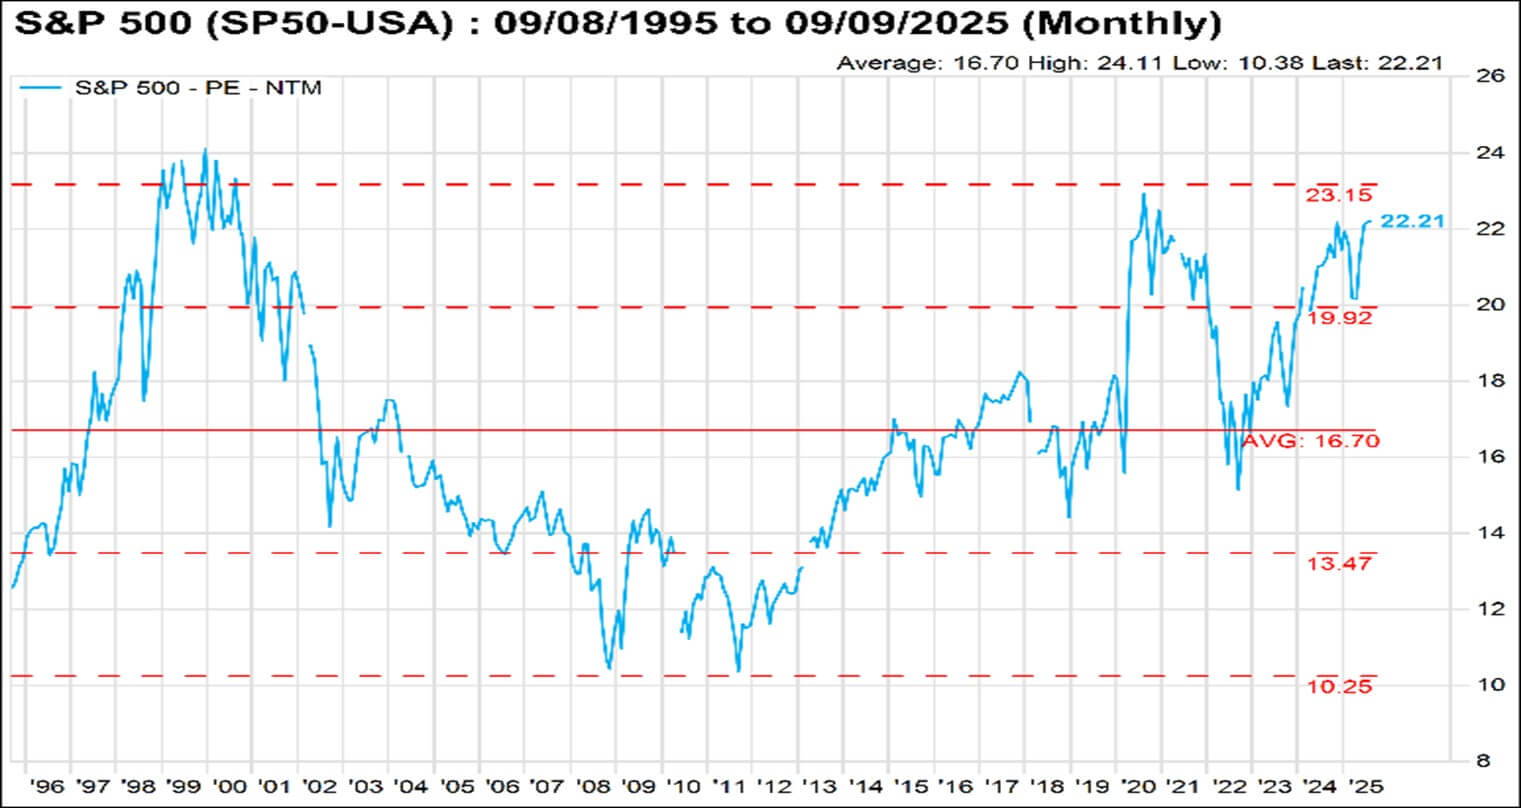
Source: FactSet
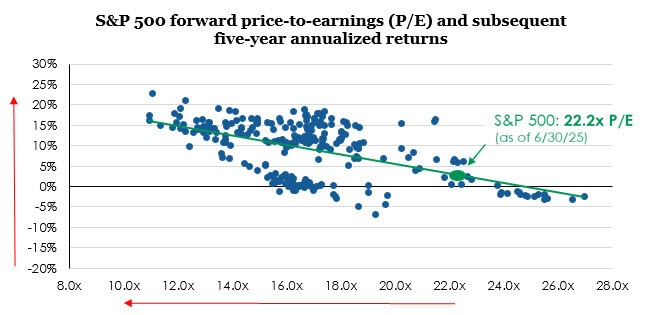
History shows that lofty valuations usually (though not always) portend lower subsequent returns:
Figure 2:

Source: FactSet, as of 6/30/2025. Forward P/E based on FactSet consensus 12-month forward earnings estimates. Returns are 60-month annualized total returns measured monthly, beginning 12/31/1999.
Past performance is no guarantee of future results. Current performance may be lower or higher than the performance data quoted. All returns reflect the reinvestment of dividends and capital gains and the deduction of transaction costs.
Beyond the quantitative metrics, one can look at investor behavior to gain a better understanding of the current state of irrationality sweeping through various markets. A quick eBay search for Labubus (a plush doll) shows prices upwards of $50,000! The Wall Street Journal recently ran an article with the headline: “The Hot Investment With a 3,000% Return? Pokémon Cards.” Meme stocks and crypto currencies are back in the forefront. An August piece from JP Morgan reveals, “From 2023 to early 2025, retail investing flows rose by about 50 percent, to levels rivaling the pandemic savings surge’s peak.”1 Toomas Laarits and Jeffrey Wurgler of NYU found in a recent research paper, “The median individual investor spends approximately six minutes on research per trade…”2 If traders deal in speculation and investors in valuations, the evidence seems to suggest that traders are in the driver’s seat while investors are riding shotgun – along for the ride, but hardly in control. Given such, it comes as no surprise that investors are interested in potential diversification away from such euphoria.
None of this is to say that equity indices, Labubus, Pokémon cards, meme stocks, and crypto currencies can’t get more expensive – generating positive (if not substantial) returns for those who get the timing right. But for those of us who prefer to focus on valuations, admitting that we possess no competitive advantage in timing markets (much less Labubu markets!), it comes as no surprise that now is the time to assess the exposures of our portfolios. Naturally, we have fielded many questions asking how we, on the Private Wealth Management team at Harris Associates, view diversification, particularly in light of our significant investments in U.S. equities. In addressing this topic, we hope to illustrate how, despite running concentrated portfolios of U.S. domiciled companies, our portfolios possess more diversification than meets the eye.
Diversification can be measured across many different dimensions: small caps versus large caps, growth versus value, international versus domestic, hard assets versus fiat currencies, etc. The enumerations are seemingly endless. For the sake of brevity, the two most pertinent dimensions, as of late, have been growth versus value and international versus domestic.
The growth versus value (i.e., style) tradeoff is relatively straightforward – a product of investment approach. Morningstar classified the S&P 500 as a “growth” fund for the first time from 12/31/2023 to 6/30/2024 (only to subsequently change their methodology to reclassify the index as “blend”).
Figure 3:
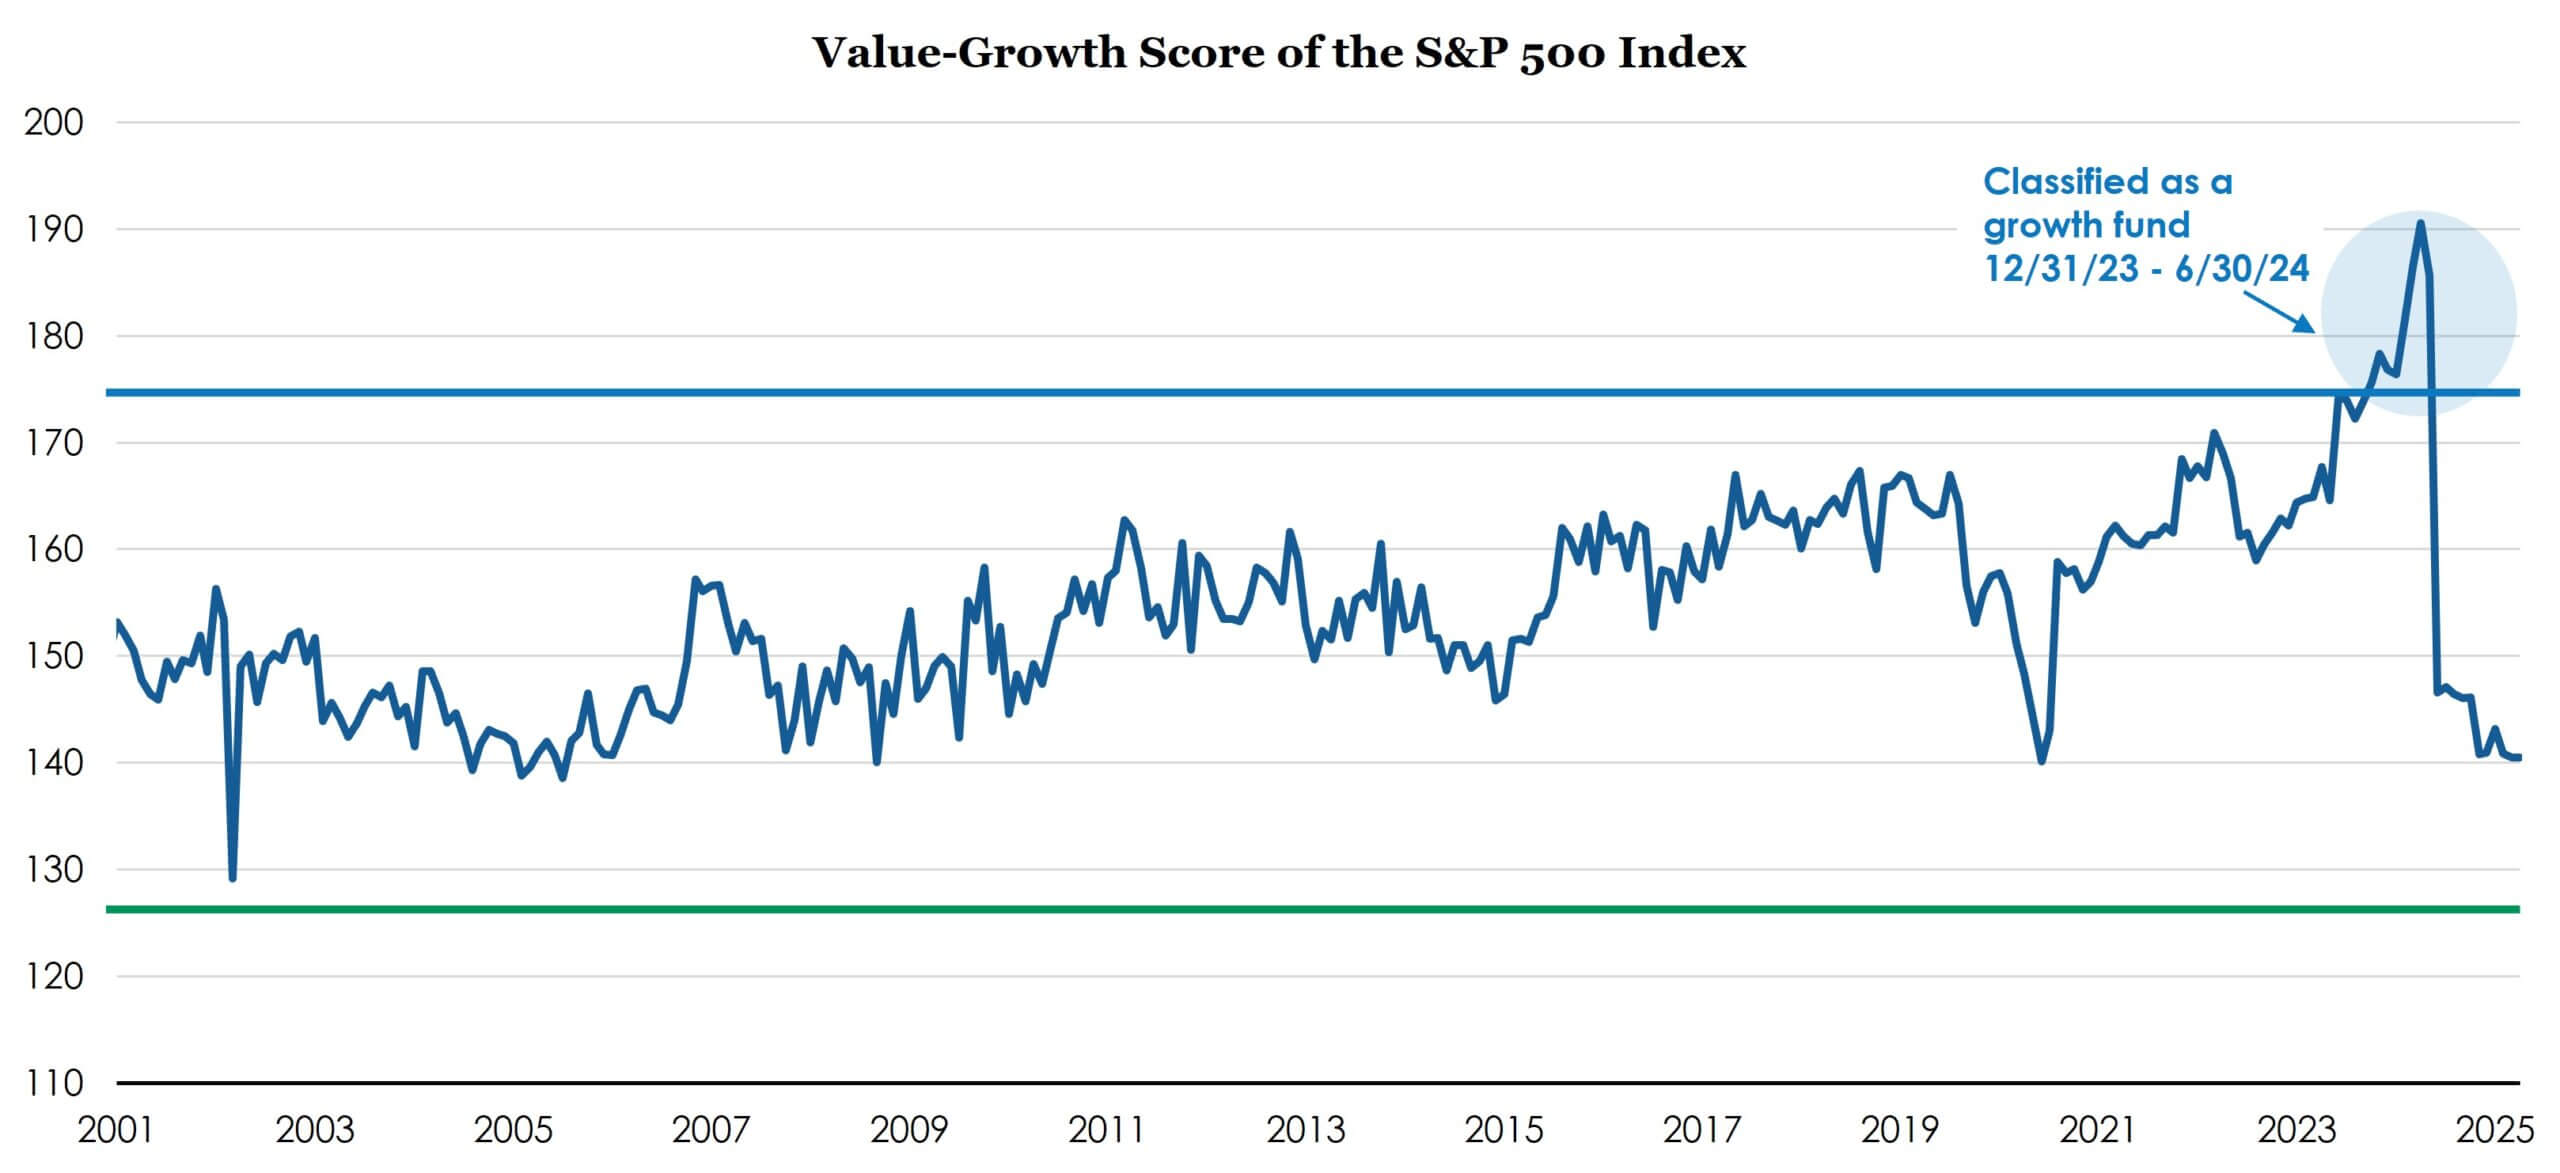
Source: Morningstar data from 9/30/2000 through 6/30/2025.
Morningstar’s Raw Value-Growth Score classifies individual stocks as value, core or growth. Morningstar will also assign Raw Value-Growth scores to a portfolio each time it discloses holdings, based on the asset-weighted average of underlying stock scores in the portfolio. A portfolio raw score less than 125 is considered value, greater than 175 is considered growth, and in between is considered blend.
The implication is that the index has evolved immensely over the past several decades – from a diversified representation of the 500 largest U.S. companies into something more akin to a concentrated, mega-cap tech, growth fund.
On the contrary, at Harris Associates, we are value managers. As the moniker suggests, this often leads us to investments that are quite different than what is represented in the current benchmark – offering the potential for significant style diversification. More precisely, our definition of “value” is to invest only in companies that trade at a significant discount to our estimate of their intrinsic value. This philosophical compass has led us, at times, to invest in names that do not screen as “typical” value investments. Alphabet and Amazon are a few examples of businesses that have at one time or another represented value investments to us, despite their traditional growth categorization. Put differently, to us, growth is a component of value: a characteristic we appreciate in our investments but want to ensure we pay the right price for. These investments, alongside our more traditional value investments, create portfolios that are invested across the growth versus value spectrum. As a result, our portfolios often trade at a significant discount to the relevant index. For example, despite the current environment, it is not uncommon for our portfolios to trade up to ten turns lower than the S&P 500. Revisiting figure 2 above, this puts our portfolios in a more favorable position for future returns – up and to the left of S&P 500.
Growth versus value, of course, is not the only way to diversify. As of late, international equities have performed quite well – igniting interest in the merit of adding international stocks to one’s portfolio. In considering international exposure, what is often meant is investment in the equity of companies that are domiciled outside of the United States. Despite the seemingly obvious connection between diversification and investing in internationally domiciled companies, the underlying drivers of price performance are more nuanced than one might think. While these companies offer unique investment opportunities, for diversification purposes, it is equally – if not more – important to consider sources of geographical revenue. In other words, the diversity (or lack thereof) of regions around the globe in which a company generates revenue is often a more significant indicator in performance than the country in which it is domiciled.
A recent paper by FactSet builds upon research that examines the implications of geographical revenue diversification. It concluded, “Multiple studies have found that a company’s revenue geography offers stronger explanatory power for stock performance than its listing domicile, particularly during periods of macroeconomic stress.”3 Interestingly, relative performance (i.e., the price performance of a company with globally diverse revenue streams relative to one with a domestically concentrated revenue stream) may not be as obvious as it seems. Consider the primary motivations for international exposure today: geopolitical conflicts, trade uncertainty, volatility in currency valuations, winners and losers in the current trend towards deglobalization, etc. In these environments, domestically concentrated companies have typically outperformed their diversified counterparts. As the FactSet paper explains:
“Companies with globally distributed revenues tend to benefit when macro conditions support cross-border growth—stable currencies, healthy trade volumes, accommodative policy, and low volatility—but often lead the downside during periods of geopolitical stress, financial tightening, and disrupted global flows.”
So, in the context of international versus domestic diversification, it is not solely the investment in internationally domiciled companies – nor is it solely the investment in companies with globally diverse revenue streams – that produces the benefits of diversification. Rather, the benefits are best accrued via investment in companies that generate revenue globally, as well as those that do so domestically.
Admittedly, we don’t contend to have any particularly unique insights into global macro events. It is far from our expertise. As such, to the extent that we have significant investments in companies that generate revenue globally or domestically, it is not due to our view of how macro-conditions will support or disrupt cross-border growth. However, that does not mean that our portfolios do not benefit from their inherent revenue structures.
Because we evaluate what a business is worth based on fundamental performance, not price correlation to predicted global macro events, our portfolios naturally become populated with companies that exhibit both globally diversified and domestically concentrated revenue streams (much the same way they become populated with companies that might be classified as “growth” or “value”). It is exposure across the geographic revenue stream spectrum that offers the client the benefits of diversification – not merely investing in various domiciles.
Diversification is inherently a multifaceted concept. There are enumerable dimensions. Many roads will lead you to Rome. Spend too much time balancing the exposures to every possible outcome and you risk diluting returns – a term coined by Peter Lynch as “diworsification”. Place all your eggs in one basket and you risk severe negative outcomes. Like many things in life, there is an appropriate balance. To us, the primary focus has always been, and will always be, paying an appropriate price for fundamental performance. Luckily, that does not mean that we have to sacrifice the benefits of diversification.
1 https://www.jpmorganchase.com/institute/all-topics/financial-health-wealth-creation/a-decade-in-the-market-how-retail-investing-behavior-has-shifted-since-2015
2 https://www.nber.org/papers/w33625
3 https://insight.factset.com/rethinking-diversification-amid-economic-fragmentation-why-revenue-geography-matters-more-than-ever?utm_source=Direct&utm_medium=email&utm_campaign=FO-09-02-2025&utm_content=httpsinsightfactsetcomrethinkingdiversificationamideconomicfragmentationwhyrevenuegeographymattersmorethanever
Past performance is no guarantee of future results. Current performance may be lower or higher than the performance data quoted. The investment return and principal value vary so that an investor’s shares when redeemed may be worth more or less than the original cost.
The specific securities identified and described in this report do not represent all the securities purchased, sold, or recommended to advisory clients. There is no assurance that any securities discussed herein will remain in an account’s portfolio at the time one receives this report or that securities sold have not been repurchased. It should not be assumed that any of the securities, transactions, or holdings discussed herein were or will prove to be profitable.
This material is not intended to be a recommendation or investment advice, does not constitute a solicitation to buy, sell or hold a security or an investment strategy, and is not provided in a fiduciary capacity. The information provided does not take into account the specific objectives or circumstances of any particular investor or suggest any specific course of action. Investment decisions should be made based on an investor’s objectives and circumstances and in consultation with his or her advisors.
The information, data, analyses, and opinions presented herein (including current investment themes, the portfolio managers’ research and investment process, and portfolio characteristics) are for informational purposes only and represent the investments and views of the portfolio managers and Harris Associates L.P. as of the date written and are subject to change without notice. This content is not a recommendation of or an offer to buy or sell a security and is not warranted to be correct, complete or accurate. Certain comments herein are based on current expectations and are considered “forward-looking statements”. These forward looking statements reflect assumptions and analyses made by the portfolio managers and Harris Associates L.P. based on their experience and perception of historical trends, current conditions, expected future developments, and other factors they believe are relevant. Actual future results are subject to a number of investment and other risks and may prove to be different from expectations. Readers are cautioned not to place undue reliance on the forward-looking statements.
The S&P 500 Index is a float-adjusted, capitalization-weighted index of 500 U.S. large-capitalization stocks representing all major industries. It is a widely recognized index of broad, U.S. equity market performance. Returns reflect the reinvestment of dividends. This index is unman-aged and investors cannot invest directly in this index.
All information provided is as of 09/30/2025 unless otherwise specified.