
You can’t predict, [but] you can prepare.
Howard Marks, American Investor and Author
Three quarters of the way through the seeming “decade” that is 2020, unpredictability seems to be a persistent attribute. Whether it be market performance, pandemic arrival and impact, or the upcoming U.S. elections, prognostications made throughout the year most certainly have proven unreliable. Given all of this and the market’s historical aversion to unpredictability, there is an element of surprise that the S&P 500 Index is up over 5% through the first nine months of the year and up over 50% from the March 23rd lows.
While the broad market has seen a significant rebound and generated positive returns for the year, not all companies or sectors have participated evenly. So far this year, the Russell 1000 Growth Index has returned almost 25%, besting its value-oriented counterpart by almost 37%! This year has continued, and in some cases exacerbated, a trend that has persisted throughout the last decade. In the last 10 years, the aforementioned growth and value indexes have returned 17% and 10% per year, respectively.
We have seen growth and value diverge like this throughout our firm’s history. These periods are not the most comfortable to endure, but we remain resolute in our longstanding investment philosophy and process. While not always the most fashionable approach at dinner parties, buying one dollar worth of value for 60 cents has proven to be rewarding over time. Much has been written about the “death of value” and the fundamental shift in every part of the economy. While we categorically reject the former assertion, the latter has some merit, even if overstated.
Currently, we’re seeing a handful of growth stocks driving the broad index higher. Five stocks make up over 20% of the S&P 500 and that index’s positive return for the year has come mostly from multiple expansion, meaning investors are willing to pay a higher price for each $1 of earnings. Jeff Bezos has built a phenomenal and very valuable business at Amazon. Its stock performance has been a key driver for the S&P 500 year-to-date. But at its current quote, the stock is trading at almost 100x next year’s earnings based on data from FactSet. Is there potential for Amazon to grow into that type of earnings multiple? Perhaps, but if it does not, it could be a very costly bet for traders getting involved at these prices.
So while we do find some of these companies attractive, current valuations make it difficult to make a case that something beyond irrational exuberance is driving some of these stocks’ prices higher. It may not be a mirror image of the late 1990s dot-com mania, but there are some similarities with observations of today’s market environment. Thus far in 2020, 25 stocks increased at least 400% at some point. According to Dow Jones, that is the largest number since 2000, which was when 30 stocks achieved that milestone. The last time more than 10 stocks saw that happen was in 2009 coming out of the depths of the financial crisis.
Pulling back further, growth stocks are priced close to their peak when compared to value stocks. The graph below shows the price-to-earnings ratio (P/E) of the 75 fastest growing companies compared to the same multiple of the 100 “cheapest” companies; meaning the ones with the lowest trailing P/E multiples. Historically, the ratio has bounced around the 2-4x range and it sat right around 3x last year. Today, we are looking at a ratio that is close to 10x.
Ratio of the Big Growers and Cheapest Large Capitalization Stocks Relative Trailing-P/E Ratios¹ 1952 Through Late-July 2020
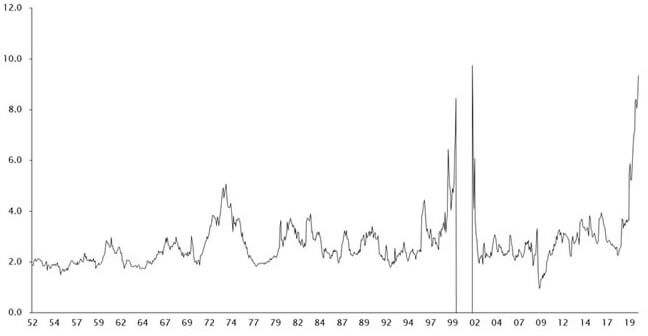
Source: Empirical Research Partners Analysis.
¹Equally-weighted data; excludes negative earnings during the New Economy era.
The important takeaway of this analysis is that stock price matters and it is not always a good proxy for the actual value of a business! We often talk about the market’s proclivity to be irrational and overreact to the short term. In a 2017 interview with Morningstar, our Chief Investment Officer-International Equity David Herro said the following when asked what he found most surprising about the most recent decade of unpredictable events:
- “That people are surprised at global events! …[G]eopolitical shocks and events flow through time. The severity is different, but shocks are the nature of the game. This is actually a very good thing for true investors as it allows you to invest in quality companies at low prices.”
The same holds true for the roller coaster that we have been on this year as well. Equities are a long-term time horizon asset and short-term price/value dislocations present opportunities for investors with patience and appreciation for what a business is truly worth. The economic crisis we have found ourselves in was born out of a global health pandemic and the bullish sentiment would argue that getting a handle on the virus will yield a return to economic certainty and long-term earnings potential remains in-tact.
The obvious follow-up question is how can investors best position themselves for the recovery? Has our economy so fundamentally shifted that stocks in the technology sector are the only way to realize gains?
There is no doubt that Covid-19 has had a dramatic impact on our day-to-day lives. The real effects and changes are present and perhaps there is still more to come. As it stands, more of our leisure time is likely spent on Netflix because we can’t go to the theater, opera, concerts, etc. Employees are working remotely at a higher rate and there are different types of software required to facilitate that type of workplace flexibility. As Microsoft CEO Satya Nadella said, “we’ve seen two years of digital transformation in two months.”
By necessity, that digital transformation can’t be the sole future of the global or U.S. economy. Many companies have leaned on tools, such as Zoom, to help navigate the current environment. While very helpful, it, too, is an expensive stock. That said, Zoom needs companies to actually have meetings for its business to thrive! Simply put, software companies can’t just sell software to each other.
A prosperous economy is a dynamic ecosystem with multiple sectors contributing. Healthy financial institutions borrowing and lending money. Industrials manufacturing and selling machinery. Pharmaceutical companies researching and developing drugs. Energy companies pulling natural gas and oil out of the ground and the subsequent refining required. Commercial real estate brokerage firms selling, leasing and managing properties. If these companies are not healthy and functioning, who will tech stalwarts sell to?
Digging into valuations of companies in some of those industries, we believe there can be significant upside for patient investors. Currently, the S&P 500 trades close to 30x its normalized cyclically adjusted price to earnings ratio (CAPE). CAPE captures a company’s profits over a trailing 10-year time horizon and current price is around the top three most overvalued levels in history, according to the Financial Post.1
That analysis found that tech stocks are priced at approximately 44x, or the 88th percentile, of their historical average. At the same time, financials are priced in the 34th percentile of their historical averages, consumer staples are in the 59th and industrials are in the 41st. As investment managers, we are agnostic to a company’s listed sector, but observing historically low prices portends a good opportunity.
This year has been an excellent example of the people’s ability to demonstrate resilience in the face of adversity. While we do not wish to equate value investing with the adversity some have faced, resilience is important in periods such as this. Value may have been out of favor for some time now and waiting for that favor to turn can test even the most patient. But those who exhibited the requisite patience in the late 1990s dot-com bubble were rewarded. In the decade that followed, our composite performance returned 112% from January 2000 through December 2009. By comparison, the S&P 500’s return was negative 9%.
As always, we thank you for entrusting us with your investment assets and your continued support. We hope you and your family stay safe and healthy.
1Financial Post article: https://financialpost.com/investing/david-rosenberg-valuations-still-matter-heres-an-easy-way-to-look-for-undervalued-stocks
Past performance is no guarantee of future results. Current performance may be lower or higher than the performance data quoted. The gross performance presented does not reflect the deduction of investment advisory fees. All returns reflect the reinvestment of dividends and capital gains and the deduction of transaction costs. The client’s return will be reduced by the advisory fees and other expenses it may incur in the management of its account. The advisory fee, compounded over a period of years, will have an adverse effect on the value of the client’s portfolio.
The information, data, analyses, and opinions presented herein (including current investment themes, the portfolio managers’ research and investment process, and portfolio characteristics) are for informational purposes only and represent the investments and views of the portfolio managers and Harris Associates L.P. as of the date written and are subject to change without notice. This content is not a recommendation of or an offer to buy or sell a security and is not warranted to be correct, complete or accurate.
Certain comments herein are based on current expectations and are considered “forward-looking statements”. These forward looking statements reflect assumptions and analyses made by the portfolio managers and Harris Associates L.P. based on their experience and perception of historical trends, current conditions, expected future developments, and other factors they believe are relevant. Actual future results are subject to a number of investment and other risks and may prove to be different from expectations. Readers are cautioned not to place undue reliance on the forward-looking statements.
The S&P 500 Total Return Index is a float-adjusted, capitalization-weighted index of 500 U.S. large-capitalization stocks representing all major industries. It is a widely recognized index of broad, U.S. equity market performance. Returns reflect the reinvestment of dividends. This index is unmanaged and investors cannot invest directly in this index.
Russell 1000® Growth Index is an unmanaged index that measures the performance of the large-cap growth segment of the U.S. equity universe. It includes those Russell 1000® companies with higher price-to-book ratios and higher forecasted growth values. This index is unmanaged and investors cannot invest directly in this index.
The price to earnings ratio (“P/E”) compares a company’s current share price to its per-share earnings. It may also be known as the “price multiple” or “earnings multiple”, and gives a general indication of how expensive or cheap a stock is. Investors should not base investment decisions on any single attribute or characteristic data point.
The cyclically adjusted price-to-earnings ratio, commonly known as CAPE, Shiller P/E, or P/E 10 ratio, is a valuation measure usually applied to the US S&P 500 equity market. It is defined as price divided by the average of ten years of earnings (moving average), adjusted for inflation. The ratio is used to gauge whether a stock is undervalued or overvalued by comparing its current market price to its inflation adjusted historical earnings record.
Investing in value stocks presents the risk that value stocks may fall out of favor with investors and underperform growth stocks during given periods.