
Twelve months ago, we were at the onset of a global pandemic, the likes of which only those in the centenarian-plus club have remotely experienced. While not completely out of the woods as a country or globe, we are starting to see the light at the end of the tunnel. Economies are strengthening as countries reopen and millions are getting vaccinated by the day. At the risk of sounding overly trite, what a difference a year makes!
That is not to ignore the hardships of the past 12 months. It has been difficult for many as people have dealt with death of loved ones, the hardships of job loss or furlough, the mental toll of stay-at-home orders, etc. Despite that backdrop, the stock market continues to push ever higher on the expectations of released pent-up demand, fueled partially by expansive fiscal policy that helped people through the difficult times. Using the S&P 500 Index as a proxy for equities, stocks have returned 56% year-over-year, which we think is a remarkable return given the economic uncertainty many have faced.
In addition to large-cap stocks, there has been an increase in investor appetite for risk similar to what we saw coming out of the great financial crisis. Whether the rise and fall of Gamestop, the increase in SPAC (special purpose acquisition company) investments or the latest, NFTs (non-fungible tokens), investors seem keen to latch on to the latest and “greatest.” Some of that rise is fueled by income that previously was likely earmarked for travel, dinners or other activities we have avoided.
Investor sentiment favoring a larger appetite for risk and generous returns is not confined to the last 12 months but rather the last 12 years. Since the end of 2008, the S&P 500 has been in the red for the year on December 31 only one time, which was in 2018. Obviously there have been fits and starts along the way, so though it has not been perfectly linear, that should not be expected. That type of bull run has left people looking for what’s next or what it means for portfolio opportunities. While it is important to consider that aspect and how to rebalance, something else that needs to ultimately be addressed are capital gains and taxes.
In spite of the risk-seeking sentiment we have seen, it has been widely reported that household balance sheets are stronger than ever, buoyed by stock gains and fewer options to deploy disposable income. This comes in stark contrast to how households are normally situated when we’re anticipating a recovery from an economic recession. In addition, the Federal Reserve has signaled an important shift in its attitude on interest rates. Previously, they were keen to raise rates at the first sign of inflation. Chairman Jerome Powell has been explicit in his view that we would need to see sustained firmness in headline inflation measures and a rosier employment outlook before we would expect to see them raise rates.
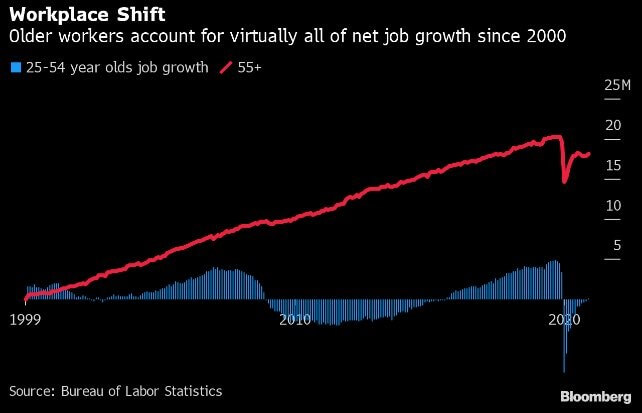
With the backdrop of a decade-plus run for stocks, interest rates that look to be lower for longer and an increased consumer risk appetite, the question is, “What do things look like going forward?” Obviously, we do not have a crystal ball, but we think the environment still looks positive. As stated above, household finances are as strong as ever. According to the U.S. Census Bureau, an estimated 1.7M are pushing up retirement dates; strong stock market performance perhaps coupled with priority reassessment post-Covid-19 likely plays a major factor there. That should portend a strong labor market for millennials and zoomers as the 55+-age cohort has accounted for nearly all net job growth since the turn of the century (Exhibit 1), according to Liz Ann Sonders from Schwab.
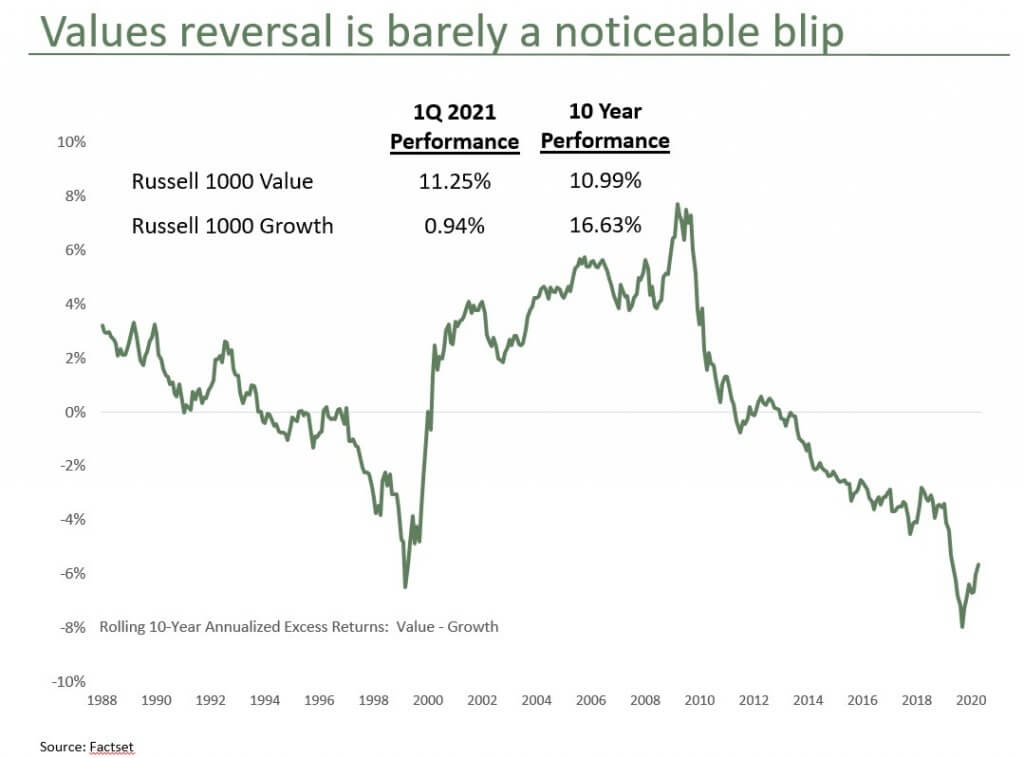
All that said, where do we see opportunity? It’s been highlighted that after the bounce back we saw from last year’s March lows growth stocks were priced at record valuations compared to their value counterparts. The beginning of the year continued to see a trend in the resurgence in value stocks. In the fourth quarter of 2020, value stocks returned a bit over 16% versus 11% for growth when comparing the Russell 1000 Value Index to the Russell 1000 Growth Index. Despite being even more dominant on a relative basis in the first quarter, the accompanying chart (Exhibit 2) shows we are still far away from historical norms when looking at 10-year annualized excess returns. The discrepancy is still near the lowest levels we have seen since the tech-fueled run at the end of the 20th century. We still believe value has a ways to go, especially as the economy continues to improve. Our value investing philosophy coupled with the fact that we run focused portfolios means we have the ability to be nimble and selective in these types of environments.
The prior strong market environment does necessitate one obvious consideration: taxes. We believe it is necessary and prudent to rebalance in periods like these. Selling names that have become too expensive to buy more attractive valuations is how we have provided great absolute returns for our clients throughout our 45-year history. This does, however, require generating capital gains to cycle into those new ideas. If ever there was an environment where investors should be more comfortable paying capital gains, we believe this would be it.
After the fiscal spend we have needed to get through the pandemic paired with the current discussions surrounding an infrastructure bill, it seems inevitable that taxes will go up in some capacity. The current administration is putting proposals on the table that could do away with the step up in basis at death; raise the capital gains rate to ordinary income, up to 39.6% in some cases; and potentially increase estate taxes as well. We try not to speculate too much on final rates, perhaps these are starting points to anchor the negotiation. Predicting where Washington will ultimately land on a policy seems a fool’s errand, especially in a government where the margins in Congress are razor thin for both parties. Given the market backdrop as well as the likelihood of rising tax rates, we think all investors should be prepared to incur higher realized capital gains and thus a higher tax bill.
As always, we thank you for entrusting us with your investment assets and your continued support. Lastly, the best compliment we can receive is a referral from a satisfied client. We appreciate your referrals and handle them with the utmost of care.
Past performance is no guarantee of future results.
The S&P 500 Total Return Index is a float-adjusted, capitalization-weighted index of 500 U.S. large-capitalization stocks representing all major industries. It is a widely recognized index of broad, U.S. equity market performance. Returns reflect the reinvestment of dividends. This index is unmanaged and investors cannot invest directly in this index.
The Russell 1000® Value Index measures the performance of the large-cap value segment of the U.S. equity universe. It includes those Russell 1000® companies with lower price-to-book ratios and lower expected growth values. This index is unmanaged and investors cannot invest directly in this index.
Russell 1000® Growth Index is an unmanaged index that measures the performance of the large-cap growth segment of the U.S. equity universe. It includes those Russell 1000® companies with higher price-to-book ratios and higher forecasted growth values. This index is unmanaged and investors cannot invest directly in this index.
The S&P 500 Total Return Index is a float-adjusted, capitalization-weighted index of 500 U.S. large-capitalization stocks representing all major industries. It is a widely recognized index of broad, U.S. equity market performance. Returns reflect the reinvestment of dividends. This index is unmanaged and investors cannot invest directly in this index.
Russell 1000® Growth Index is an unmanaged index that measures the performance of the large-cap growth segment of the U.S. equity universe. It includes those Russell 1000® companies with higher price-to-book ratios and higher forecasted growth values. This index is unmanaged and investors cannot invest directly in this index.
The Russell 1000® Value Index measures the performance of the large-cap value segment of the U.S. equity universe. It includes those Russell 1000® companies with lower price-to-book ratios and lower expected growth values. This index is unmanaged and investors cannot invest directly in this index.
The information, data, analyses, and opinions presented herein (including current investment themes, the portfolio managers’ research and investment process, and portfolio characteristics) are for informational purposes only and represent the investments and views of the portfolio managers and Harris Associates L.P. as of the date written and are subject to change without notice. This content is not a recommendation of or an offer to buy or sell a security and is not warranted to be correct, complete or accurate. Certain comments herein are based on current expectations and are considered “forward-looking statements”. These forward looking statements reflect assumptions and analyses made by the portfolio managers and Harris Associates L.P. based on their experience and perception of historical trends, current conditions, expected future developments, and other factors they believe are relevant. Actual future results are subject to a number of investment and other risks and may prove to be different from expectations. Readers are cautioned not to place undue reliance on the forward-looking statements.
Investing in value stocks presents the risk that value stocks may fall out of favor with investors and underperform growth stocks during given periods.