
Now that the Olympics have successfully come to a close, we are happy to see that the year-long delay wasn’t prolonged. We at Harris Associates can relate with the athletes who had to maintain their patience and disciplined routines amid the uncertainty. We only wish our wait had been as short as theirs.
But starting last November, value started to see its day, outperforming growth once again. By the time the first quarter of 2021 ended, five out of seven of our Harris strategies1 experienced their single best one-year returns of all time–receiving the proverbial gold medal for annual performance. And the two other strategies? They took silver, with returns up 80% and 90%.
Table 1: Ranking Each Harris Strategy One-Year Return Ending March 31, 2021 Relative to Its History
| Fund | Rolling One-Year Absolute Return (Gross) | Rolling One-Year Absolute Return (Net) | Historical Rank |
|---|---|---|---|
| Concentrated | 82.6% | 80.9% | 1 out of 118 quarters |
| U.S. Equity | 83.0% | 81.7% | 1 out of 88 quarters |
| Global All Cap | 86.0% | 84.6% | 1 out of 82 quarters |
| Global Concentrated | 81.2% | 79.8% | 2 out of 53 quarters |
| Global | 83.2% | 82.0% | 1 out of 52 quarters |
| International | 86.0% | 84.8% | 1 out of 111 quarters |
| International Small Cap | 92.2% | 90.4% | 2 out of 98 quarters |
However, after a strong first two months of the second quarter, growth roared back in a record-setting June, dramatically outpacing value for the full quarter. And as of late, stock markets have fallen from their highs as the media’s obsession with the fast-spreading delta variant has frightened investors. So, is this the end of the value run?
Bill Nygren, Harris Associates Chief Investment Officer-U.S. Equities, recently weighed in on the subject. “For those of you who are concerned that the value run might be over, clearly our funds have had an unusually good trailing year. But that outperformance wasn’t driven by a good relative period for value. The Russell Value and the Russell Growth Indexes each increased by similar amounts, 43.7% and 42.4% respectively, over the past year through June 30. So everything I’ve been talking about over the past year, highlighting what we believe is an unusually large opportunity to add value by focusing on stock price rather than just expected earnings growth, is just as valid today as it was then.”
After the strong one-year returns for value, it might be surprising to hear that valuations are still at historic lows for the price paid for value versus the price paid for growth. For example, European and global value indexes are trading at a 53% and 51% P/E discount to growth, respectively. Today’s levels are the lowest in over two decades, while the historic relationship is closer to a 30% discount.
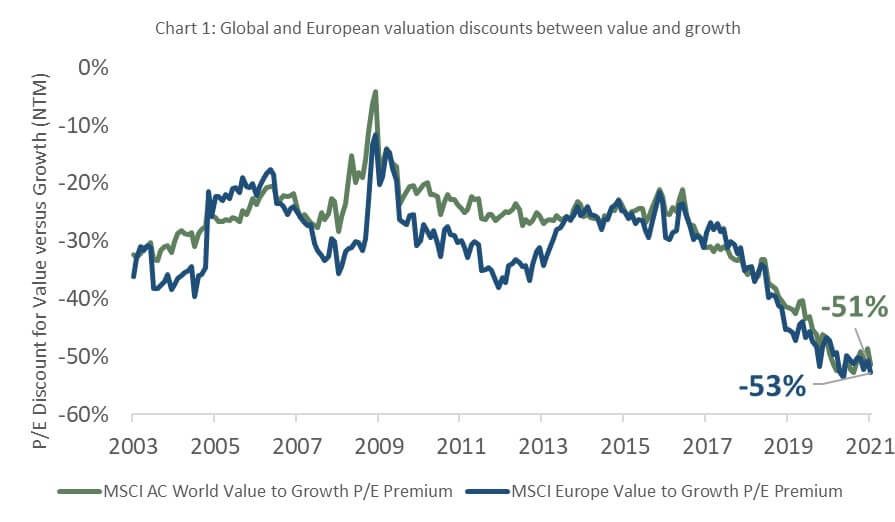
David Herro, Harris Associates Chief Investment Officer-International Equities, believes this gap between value and growth will close. “I expect to see pressure on interest rates benefit the greatest pocket of value—global financials. Other areas in the international market, including industrials and materials, are well placed to benefit from higher growth due to the reopening of national economics and further stimulus.”
At Harris Associates, our investment team will keep its focus on measuring fundamental business value so we can keep score of the most attractive risk-rewards in the market. Our dialogue with management teams suggests they adeptly managed through the pandemic and their businesses are benefiting from the reopening of the global economy. Yet, the select businesses we own are still trading at significant discounts to our estimate of intrinsic value.
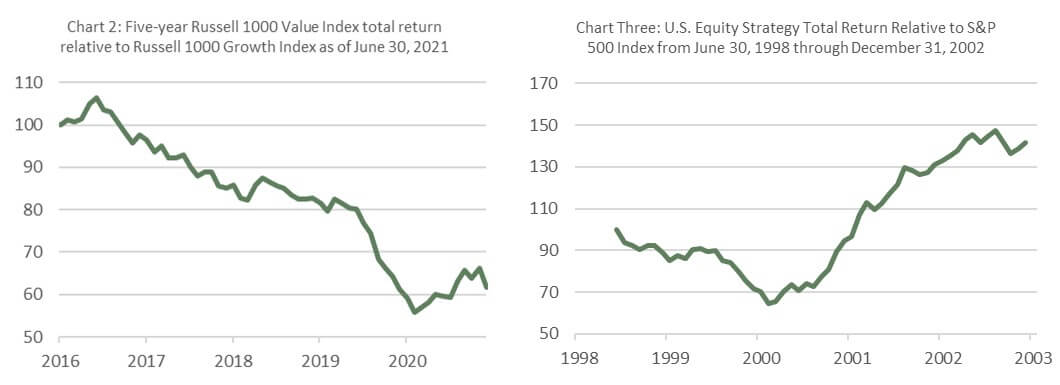
The relative returns of the Russell Value versus Russell Growth Indexes over the last five years still resemble the descent from the 10-meter diving platform (Chart 2). This time period reminds us of the internet bubble in 2000 when the U.S. Equity Strategy outperformed the S&P 500 by 2900bps. But it wasn’t too late. Given the exuberance that built up the bubble, the Strategy’s since inception trailing performance (06/30/98) still lagged the S&P 500 by 600bps. In 2001 and 2002, the Strategy went on to outperform by another 3400bps (Chart 3). We think this is a similar situation because the magnitude of the slope was—and is—so steep. If the comparison holds, we believe our investors are set up for similar relative performance in the years ahead.
We think the latest bout of uncertainty provides a great opportunity. We don’t believe investors should be underweight value going into an accelerating period of economic growth. At Harris Associates, our experience suggests we are closer to the opening ceremony than the closing ceremony of the value recovery.
Go USA!
1The Japan Equity Strategy was not featured in the analysis due to its asset size as of 03/31/21.
Past performance is no guarantee of future results. Both gross and net returns reflect the reinvestment of income and the deduction of transaction costs. Gross returns do not reflect the deduction of investment advisory fees or any other expenses that may be incurred in the management of the account. Performance presented does not reflect the deduction of investment advisory fees. The client’s return will be reduced by the advisory fees and other expenses it may incur in the management of its account. Investment advisory fees are described in Part 2A of our ADV. The advisory fee, compounded over a period of years, will have an adverse effect on the value of the client’s portfolio.
The price to earnings ratio (“P/E”) compares a company’s current share price to its per-share earnings. It may also be known as the “price multiple” or “earnings multiple”, and gives a general indication of how expensive or cheap a stock is. Investors should not base investment decisions on any single attribute or characteristic data point.
The Russell 1000® Value Index measures the performance of the large-cap value segment of the U.S. equity universe. It includes those Russell 1000® companies with lower price-to-book ratios and lower expected growth values. This index is unmanaged and investors cannot invest directly in this index.
The Russell 1000® Growth Index measures the performance of the large-cap growth segment of the U.S. equity universe. It includes those Russell 1000® companies with higher price-to-book ratios and higher forecasted growth values. This index is unmanaged and investors cannot invest directly in this index.
The S&P 500 Total Return Index is a float-adjusted, capitalization-weighted index of 500 U.S. large-capitalization stocks representing all major industries. It is a widely recognized index of broad, U.S. equity market performance. Returns reflect the reinvestment of dividends. This index is unmanaged and investors cannot invest directly in this index.
Investing in value stocks presents the risk that value stocks may fall out of favor with investors and underperform growth stocks during given periods.
The information, data, analyses, and opinions presented herein (including current investment themes, the portfolio managers’ research and investment process, and portfolio characteristics) are for informational purposes only and represent the investments and views of the portfolio managers and Harris Associates L.P. as of the date written and are subject to change and may change based on market and other conditions and without notice. This content is not a recommendation of or an offer to buy or sell a security and is not warranted to be correct, complete or accurate.
Certain comments herein are based on current expectations and are considered “forward-looking statements”. These forward looking statements reflect assumptions and analyses made by the portfolio managers and Harris Associates L.P. based on their experience and perception of historical trends, current conditions, expected future developments, and other factors they believe are relevant. Actual future results are subject to a number of investment and other risks and may prove to be different from expectations. Readers are cautioned not to place undue reliance on the forward-looking statements.