
Many investors have been trepidatious when it comes to the positive market movement we have seen in 2023. Coming off a rocky, potentially oversold 2022 positive momentum made sense. However, given the global macroeconomic questions, investors speculated that stocks looked expensive through the first six months of this year. By digging deeper and employing our long-term valuation-based approach, there are still opportunities to be had.
The lack of market breadth was an important and relevant topic coming out of the second quarter as we discussed in great detail at the time. Five stocks contributed to 80% of the market’s mid-teens return through June 30. That lack of diversity of positive contributors has been exacerbated through the end of the third quarter. Seven companies make up 84% of the market’s year-to-date return as of September 30.
In terms of market capitalization, the S&P 500 has never been more concentrated than it is today. We highlighted that as of June 30, 20 names composed approximately 30% of the index. Fast forward three months: now the weight of the top 10 stocks is a shade under 32%. The momentum of the first six months continued through the next three—winners kept winning and losers kept losing.
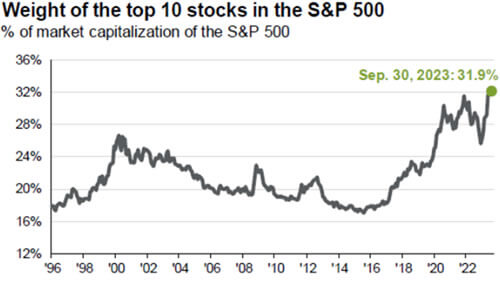
Source: Nate Geraci, Bloomberg. Dates depicted 09/30/1996 to 9/30/2023.
The market’s concentration in those top few names has driven that expensive appearance. When the financial press has implored that “stocks look expensive,” that is a fair characterization when the S&P 500 was priced at 23x earnings, especially when you factor in current interest rate levels. Historically speaking, interest rates and P/E ratios have exhibited an inverse relationship: higher interest rates lead to lower P/E multiples for stocks. So, given the highest interest rates since before the global financial crisis, how could the S&P 500 support a P/E multiple in approximately the 65th percentile of its historical distribution?
As we have too often come to expect in the modern news cycle, it’s important to dig past the headline. Looking back almost a decade paints an incredibly interesting picture relative to 2023.
Through the end of September, the S&P 500 was up 12%, which is a reasonable comparison to the 11% appreciation in 2014. Going deeper highlights the differences between the two periods. A few comparisons include that the median stock has appreciated 1% in 2023 versus 16.24% in 2014 and the equal-weighted S&P 500 has increased 0.58% this year compared to 12% in 2014. All this to say, there is a lot of value below the surface, and many of the technology names that have driven the market in 2023 look relatively expensive.
To be sure, there are some real concerns that have kept a weight on some portions of the market: macroeconomic and the ongoing geopolitical tensions. Many people express trepidation around the consumer and their spending abilities in the current environment. Given the consumer is approximately two-thirds of the economy, it is a reasonable concern.
We still do not know the impact of student loan repayments restarting in October. The pace of inflation has slowed but prices are still comparatively elevated. People are paying more at the pump and that has a large impact on the consumer psyche (positive or negative merits notwithstanding). For the first time ever, the U.S. surpassed $1 trillion dollars in credit card debt. That’s a headline number that would give anyone pause. But, if you look at it as a percent of total bank deposits, it is just 6% of total deposits; the lowest number in two decades. That could be a function of wealth inequality or people leveraging cash on hand to enjoy the rewards programs of their various credit cards.
Depending on your preferences, different macroeconomic variables can paint the user’s preferred picture. The credit card debt anecdote above is a good example of leveraging interpretation to make two wholly different points. This is why we do our best to tune out the macroeconomic topics du jour and look at what a company’s earnings power is in a “normal” environment. For example, we value automakers and auto parts suppliers on what a normal seasonally adjusted annual rate of production is; we value the oil and gas companies based on what we believe the long-term equilibrium oil price should be; we value our financials by normalizing interest rates; and so on across a variety of industries and companies.
All this is to say that a market index that has expensive headline P/E multiple driven by 10 names means there is plenty of value for us to discover. This is not to say all stocks are cheap or that fixed income alternatives have not become more attractive. To be clear, bonds have become more attractive, and the risk/reward trade-off is an important topic to consider. But for clients concerned about their equity exposure, we believe the ability to capitalize on opportunity via active management has never been more important and present.
Gas prices will impact sentiment, inflation could increase demand for private label versus brand names when wandering through the grocery store, and the 2024 U.S. presidential race is likely to move markets one way or the other. Stock prices may fluctuate on whatever the news of the day is, while business values are generally much more stable, which gives investors a window of positivity for equities.
As always, we thank you for entrusting us with your investment assets and your continued support. Lastly, the best compliment we can receive is a referral from a satisfied client. We appreciate your referrals and handle them with the utmost care.
Past performance is no guarantee of future results. Current performance may be lower or higher than the performance data quoted. All returns reflect the reinvestment of dividends and capital gains and the deduction of transaction costs.
The specific securities identified and described in this report do not represent all the securities purchased, sold, or recommended to advisory clients. There is no assurance that any securities discussed herein will remain in an account’s portfolio at the time one receives this report or that securities sold have not been repurchased. It should not be assumed that any of the securities, transactions, or holdings discussed herein were or will prove to be profitable.
The information, data, analyses, and opinions presented herein (including current investment themes, the portfolio managers’ research and investment process, and portfolio characteristics) are for informational purposes only and represent the investments and views of the portfolio managers and Harris Associates L.P. as of the date written and are subject to change without notice. This content is not a recommendation of or an offer to buy or sell a security and is not warranted to be correct, complete or accurate.
The price to earnings ratio (“P/E”) compares a company’s current share price to its per-share earnings. It may also be known as the “price multiple” or “earnings multiple”, and gives a general indication of how expensive or cheap a stock is. Investors should not base investment decisions on any single attribute or characteristic data point.
The S&P 500 Total Return Index is a float-adjusted, capitalization-weighted index of 500 U.S. large-capitalization stocks representing all major industries. It is a widely recognized index of broad, U.S. equity market performance. Returns reflect the reinvestment of dividends. This index is unmanaged and investors cannot invest directly in this index.
Investing in value stocks presents the risk that value stocks may fall out of favor with investors and underperform growth stocks during given periods.
Harris Associates L.P. does not provide tax or legal advice. Please consult with a tax or legal professional prior to making any investment decisions.